Simulation and Assessment of Sun-induced Chlorophyll Fluorescence and Gross Primary Production in Pinus sylvestris var. mongolica Plantation Based on the SCOPE Model
-
摘要:
目的 检验SCOPE(Soil Canopy Observation of Photosynthesis and Energy fluxes)模型用于模拟樟子松人工林的日光诱导叶绿素荧光(sun-induced chlorophyll fluorescence, SIF)和植被总初级生产力(gross primary productivity, GPP)动态变化的可能性。 方法 对科尔沁沙地南缘樟子松人工林,基于样地SIF、GPP及气象协同观测数据,利用SCOPE模型模拟SIF与GPP的日变化与季节变化,评估了SCOPE模型在典型晴天、典型多云日、整个观测期的模拟效果。 结果 结果显示,利用气象观测数据及冠层参数(入射短波辐射、气温、大气实际水汽压、CO2浓度及叶面积指数),可驱动SCOPE模型模拟樟子松人工林的SIF与GPP。典型晴天日与多云日的SIF模拟值和实测值的R2分别为0.42与0.52,RMSE分别为0.19与0.18 W·m−2·μm−1·sr−1;GPP模拟值和观测值的R2分别为0.78与0.89,RMSE分别为1.87与2.57 μmol·m−2·s−1。在季节尺度上,SIF和GPP模拟值和观测值的R2分别为0.50、0.72,RMSE分别为0.19 W·m−2·μm−1·sr−1和2.64 μmol·m−2·s−1。在整个观测期,多云日的SIF(R2=0.31, RMSE=0.22 W·m−2·μm−1·sr−1)与 GPP(R2=0.80, RMSE =2.42 μmol·m−2·s−1)的模拟效果优于晴天日(SIF:R2=0.30,RMSE=0.26 W·m−2·μm−1·sr−1,GPP:R2=0.64,RMSE=3.64 μmol·m−2·s−1)。SIF模拟值总体高于观测值,当SIF强度较低时易对SIF高估,反之则易低估。GPP的模拟精度较高,模型对较低与较高GPP有所低估,对中间值有所高估。 结论 SCOPE模型可用于日尺度与季节尺度的SIF与GPP模拟,且多云日的模拟精度更高。SCOPE模型对樟子松人工林的GPP模拟结果优于SIF,推测SIF模拟精度较低的原因可能是模型对SIF的模拟是基于阔叶植物的辐射传输过程。未来应发展针对针叶植物的SIF辐射传输模型,为针叶林的辐射传输与荧光遥感监测提供模型基础。 Abstract:Objective To investigate the possibility of using SCOPE (Soil Canopy Observation of Photosynthesis and Energy fluxes) model to simulate the dynamic changes of sun-induced chlorophyll fluorescence (SIF) and gross primary productivity (GPP) in Pinus sylvestris var. mongolica plantation. Methods This study focused on a P. sylvestris var. mongolica plantation on the southern edge of the Horqin Sandy Land. Using coordinated observations SIF, GPP, and meteorological data, we simulated the diurnal and seasonal variations of SIF and GPP in the P. sylvestris var. mongolica plantation based on the SCOPE model. The model's performance was evaluated for a typical sunny day, a typical cloudy day, and the entire observation period. Results The results showed that using meteorological observation data and canopy parameters (incoming shortwave radiation, air temperature, atmospheric vapor pressure, CO2 concentration, and leaf area index), the SCOPE model can be driven to simulate the SIF and GPP in the P. sylvestris var. mongolica plantation. The R2 values for SIF simulations on a typical sunny and cloudy day were 0.42 and 0.52, with RMSE values of 0.19 and 0.18 W·m−2·μm−1·sr−1, respectively. The R2 values for GPP simulations on these days were 0.78 and 0.89, with RMSE values of 1.87 and 2.57 μmol·m−2·s−1, respectively. At the seasonal scale, the R2 values for SIF and GPP were 0.50 and 0.72, with RMSE values of 0.19 W·m−2·μm−1·sr−1 and 2.64 μmol·m−2·s−1, respectively. Throughout the observation period, the simulations of SIF (R2=0.31, RMSE=0.22 W·m−2·μm−1·sr−1) and GPP (R2=0.80, RMSE=2.42 μmol·m−2·s−1) on cloudy days were better than those on sunny days (SIF: R2=0.30, RMSE=0.26 W·m−2·μm−1·sr−1; GPP: R2=0.64, RMSE=3.64 μmol·m−2·s−1). Overall, the simulated SIF values were higher than the observed values, and the model tended to overestimate SIF at low intensities and underestimate it at high intensities. While GPP simulations demonstrated high accuracy, with slight underestimation for both low and high GPP and slight overestimation for intermediate values. Conclusion The SCOPE model is suitable for simulating daily and seasonal variations of SIF and GPP, with higher accuracy in simulations on cloudy days. The model's performance in simulating GPP in the P. sylvestris var. mongolica plantation is better than its performance in simulating SIF. The lower accuracy of SIF simulations is speculated to be due to the model being based on the radiation transfer process of broadleaf plants. Future efforts should focus on developing SIF radiative transfer models specifically for needle forests to establish a modeling foundation for the radiative transfer and fluorescence remote sensing monitoring of needle forests. -
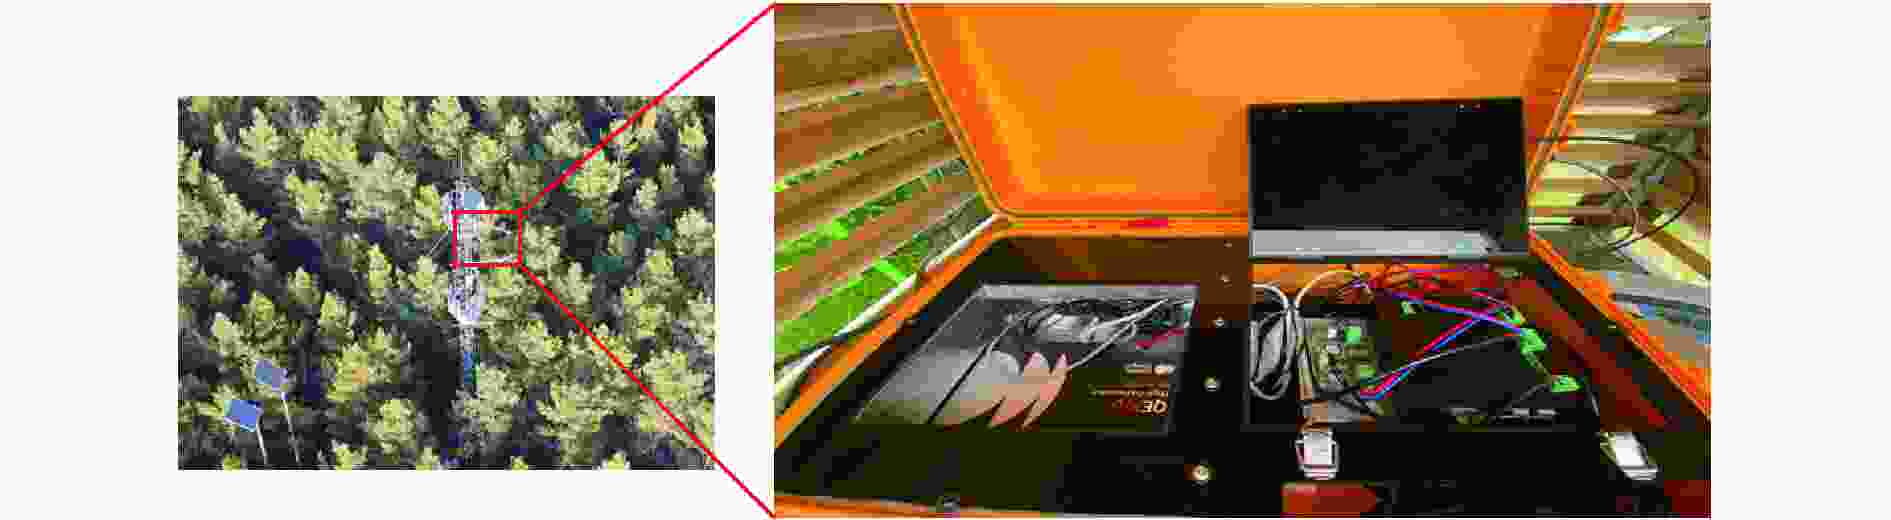
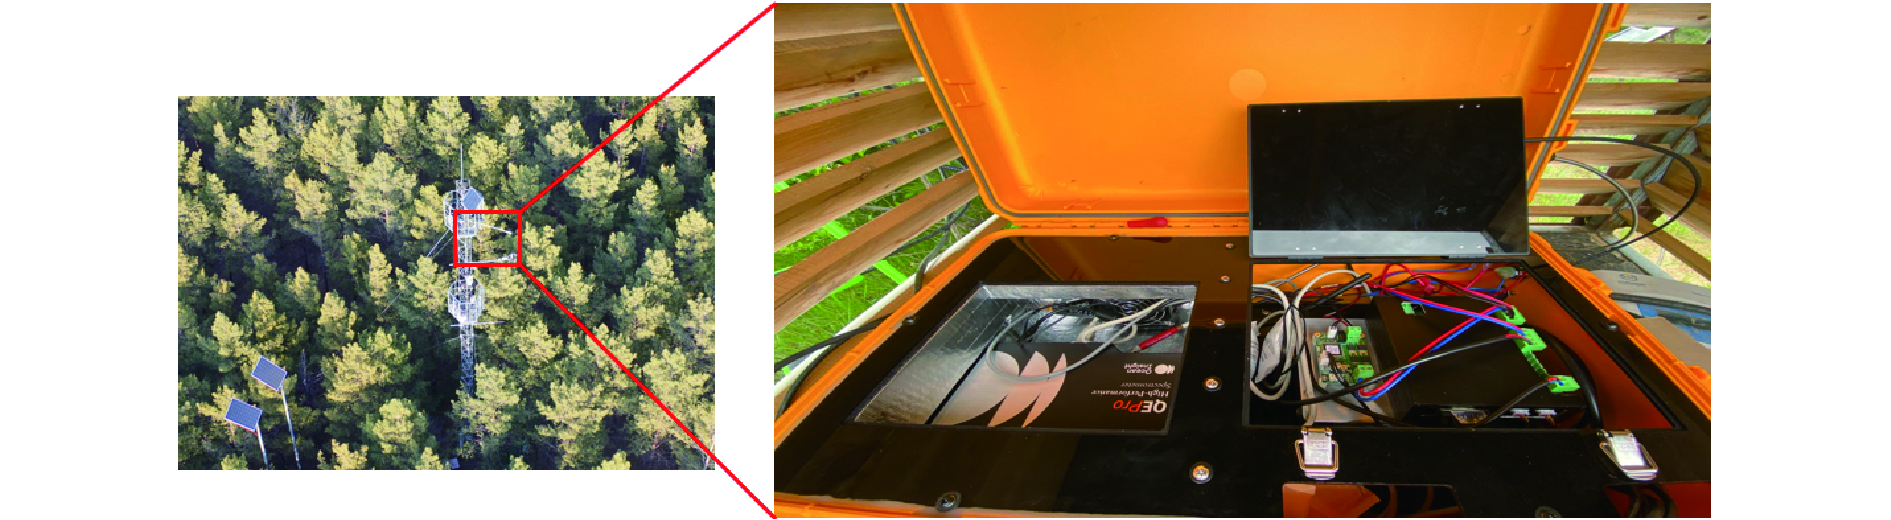
图 1 科尔沁沙地南缘辽宁省建平县樟子松人工林观测点(41°58'169″ N,119°25'104″ E)及荧光通量与气象协同观测设备
Figure 1. Observation site of the Pinus sylvestris var. mongolica plantation in Jianping, Liaoning Province, on the southern edge of the Horqin Sandy Land (41°58'169″ N, 119°25'104″ E), and the fluorescence, flux and meteorological co-observation equipment

图 2 樟子松人工林日光诱导叶绿素荧光(SIF)与植被总初级生产力(GPP)典型晴天和典型多云日变化
注:典型晴天日(8月22日) ,典型多云日(8月29日)。Typical sunny day (August 22), typical cloudy day (August 29).
Figure 2. Diurnal variations of sun-induced chlorophyll fluorescence (SIF) and gross primary productivity (GPP) of Pinus sylvestris var. mongolica plantation on a typical sunny day and a typical cloudy day

图 3 不同天气状况下樟子松人工林SIF与GPP的日散点图
注:典型晴天日(8月22日) ,典型多云日(8月22日) 。Typical sunny day (August 22), typical cloudy day (August 29).
Figure 3. Scatter plots of daily SIF and GPP in the Pinus sylvestris var. mongolica plantation under different weather conditions

图 4 樟子松人工林日光诱导叶绿素荧光(SIF)与植被总初级生产力(GPP)全观测期模拟值与实测值评估(2022年8月至12月)
Figure 4. Evaluation of simulated and measured sun-induced chlorophyll fluorescence (SIF) and gross primary productivity (GPP) of Pinus sylvestris var. mongolica plantation throughout the observation period (August to December, 2022)

图 5 樟子松人工林日光诱导叶绿素荧光(SIF)与植被总初级生产力(GPP)全观测期变化(2022年8月至12月)
Figure 5. Variations of sun-induced chlorophyll fluorescence (SIF) and gross primary productivity (GPP) of Pinus sylvestris var. mongolica plantation throughout the observation period (August to December 2022)

图 6 基于SCOPE模型的晴天和多云天气条件下樟子松人工林日光诱导叶绿素荧光(SIF)与植被总初级生产力(GPP)全观测期模拟值与实测值评估
Figure 6. Evaluation of simulated and measured sun-induced chlorophyll fluorescence (SIF) and gross primary productivity (GPP) of Pinus sylvestris var. mongolica plantation throughout the observation period under clear and cloudy weather conditions based on the SCOPE model
表 1 SCOPE模型主要参数
Table 1. Key Parameters in SCOPE Model
类型
Types定义
Definition取值
Value单位
Unit来源
Source叶片生化参数
Leaf biochemical parameters25 ℃时最大羧化速率(Vcmax25)
Maximum carboxylation rate at 25 ℃ (Vcmax25)62.5 μmol·m−2·s−1 Cui et al., 2020 Ball-Berry气孔导度模型斜率(m)
Slope of Ball-Berry stomatal
conductance model (m)观测并计算 — 观测并计算 冠层结构参数
Canopy structure parameters叶面积指数(LAI)
Leaf area index (LAI)0.88 m2·m−2 观测 叶倾角分布参数a(LIDFa)
Leaf angle distribution parameter a (LIDFa)0 — Verhoef, 1985 叶倾角分布参数b(LIDFb)
Leaf angle distribution parameter b (LIDFb)1 — Verhoef, 1985 叶片辐射传输模型参数
Leaf radiative transfer
model parameters叶绿素含量(Cab)
Chlorophyll content (Cab)20 μg·m−2 Croft et al., 2020 衰老系数(Cs)
Senescent material fraction (Cs)0 — Cui et al., 2020 叶片厚度参数(N)
Leaf thickness parameters (N)2 — Cui et al., 2020 光系统荧光量子产额(FQE)
Fluorescence quantum yield efficiency
at photosystem level (FQE)0.01 — Croft et al., 2020 气象参数
Meteorological parameters入射短波辐射(Rin)
Incoming shortwave radiation (Rin)观测 W·m−2 观测 气温(Ta)
Air temperature (Ta)观测 ℃ 观测 大气实际水汽压(ea)
Atmospheric vapor pressure (ea)观测并计算 hPa 观测并计算 CO2 浓度(Ca)
CO2 concentration (Ca)观测 mg·m−3 观测  下载: 导出CSV
-
[1] 高翔, 周宇, 孟平, 等, 2022. 辽西樟子松人工林净生态系统碳交换[J]. 应用生态学报, 33(5): 1183-1190. doi: 10.13287/j.1001-9332.202205.001 [2] 国家林业和草原局, 2019. 中国森林资源报告: 2014—2018[M]. 北京: 中国林业出版社. [3] 奚雷, 单楠, 杨沈斌, 等, 2019. 基于SCOPE模型的水稻不同生育期日光诱导叶绿素荧光及GPP模拟研究[J]. 遥感技术与应用, 34(3): 488-499. doi: 10.11873/j.issn.1004-0323.2019.3.0488 [4] 张心竹, 王鹤松, 延昊, 等, 2021. 2001—2018年中国总初级生产力时空变化的遥感研究[J]. 生态学报, 41(16): 6351-6362. doi: 10.5846/stxb202010302781 [5] Anav A, Friedlingstein P, Beer C, et al, 2015. Spatiotemporal patterns of terrestrial gross primary production: a review[J]. Reviews of Geophysics, 53(3): 785-818. doi: 10.1002/2015RG000483 [6] Björkman O, Demmig B, 1987. Photon yield of O2 evolution and chlorophyll fluorescence characteristics at 77 K among vascular plants of diverse origins[J]. Planta, 170(4): 489-504. doi: 10.1007/BF00402983 [7] Chang C Y, Guanter L, Frankenberg C, et al, 2020. Systematic assessment of retrieval methods for canopy far-red solar-induced chlorophyll fluorescence using high-frequency automated field spectroscopy[J]. Journal of Geophysical Research: Biogeosciences, 125(7): e2019JG005533. doi: 10.1029/2019JG005533 [8] Cheng X, Hu M, Zhou Y, et al, 2022. The divergence of micrometeorology sensitivity leads to changes in GPP/SIF between cork oak and poplar[J]. Agricultural and Forest Meteorology, 326(15): 109189. doi: 10.1016/j.agrformet.2022.109189 [9] Cogliati S, Verhoef W, Kraft S, et al, 2015. Retrieval of sun-induced fluorescence using advanced spectral fitting methods[J]. Remote Sensing of Environment, 169: 344-357. doi: 10.1016/j.rse.2015.08.022 [10] Cong W, Yang K, Wang F, 2022. Canopy solar-induced chlorophyll fluorescence and its link to transpiration in a temperate evergreen needleleaf forest during the fall transition[J]. Forests, 13(1): 74. doi: 10.3390/f13010074 [11] Croft H, Chen J, Wang R, et al, 2020. The global distribution of leaf chlorophyll content[J]. Remote Sensing of Environment, 236: 111479. doi: 10.1016/j.rse.2019.111479 [12] Cui T, Sun R, Xiao Z, et al, 2020. Simulating spatially distributed solar-induced chlorophyll fluorescence using a BEPS-SCOPE coupling framework[J]. Agricultural and Forest Meteorology, 295: 108169. doi: 10.1016/j.agrformet.2020.108169 [13] Dawson T P, Curran P J, Plummer S E, 1998. LIBERTY—modeling the effects of leaf biochemical concentration on reflectance spectra[J]. Remote Sensing of Environment, 65(1): 50-60. doi: 10.1016/S0034-4257(98)00007-8 [14] Farquhar G D, von Caemmerer S, Berry J A, 1980. A biochemical model of photosynthetic CO2 assimilation in leaves of C3 species[J]. Planta, 149(1): 78-90. doi: 10.1007/BF00386231 [15] Frankenberg C, Butz A, Toon G C, 2011. Disentangling chlorophyll fluorescence from atmospheric scattering effects in O2 A-band spectra of reflected sun-light[J]. Geophysical Research Letters, 38(3): L03801. doi: 10.1029/2010GL045896 [16] Frankenberg C, O’Dell C, Guanter L, et al, 2012. Remote sensing of near-infrared chlorophyll fluorescence from space in scattering atmospheres: implications for its retrieval and interferences with atmospheric CO2 retrievals[J]. Atmospheric Measurement Techniques, 5(8): 2081-2094. doi: 10.5194/amt-5-2081-2012 [17] Freedman A, Cavender-Bares J, Kebabian P L, et al, 2002. Remote sensing of solar-excited plant fluorescence as a measure of photosynthetic rate[J]. Photosynthetica, 40(1): 127-132. doi: 10.1023/A:1020131332107 [18] Gastellu-Etchegorry J, Lauret N, Yin T, et al, 2017. DART: Recent advances in remote sensing data modeling with atmosphere, polarization, and chlorophyll fluorescence[J]. IEEE Journal of Selected Topics in Applied Earth Observations and Remote Sensing, 10(6): 2640-2649. doi: 10.1109/JSTARS.2017.2685528 [19] Gauthier S, Bernier P, Kuuluvainen T, et al, 2015. Boreal forest health and global change[J]. Science, 349(6250): 819-822. doi: 10.1126/science.aaa9092 [20] Guo H, Zhou X, Dong Y, et al, 2023. On the use of machine learning methods to improve the estimation of gross primary productivity of maize field with drip irrigation[J]. Ecological Modelling, 476: 110250. doi: 10.1016/j.ecolmodel.2022.110250 [21] Hernández-Clemente R, North P R J, Hornero A, et al, 2017. Assessing the effects of forest health on sun-induced chlorophyll fluorescence using the FluorFLIGHT 3-D radiative transfer model to account for forest structure[J]. Remote Sensing of Environment, 193: 165-179. doi: 10.1016/j.rse.2017.02.012 [22] Hoshika Y, Fares S, Savi F, et al, 2017. Stomatal conductance models for ozone risk assessment at canopy level in two Mediterranean evergreen forests[J]. Agricultural and Forest Meteorology, 234/235(15): 212-221. doi: 10.1016/j.agrformet.2017.01.005 [23] Hu J, Liu X, Liu L, et al, 2018. Evaluating the performance of the SCOPE model in simulating canopy solar-induced chlorophyll fluorescence[J]. Remote Sensing, 10(2): 250. doi: 10.3390/rs10020250 [24] Jacquemoud S, Baret F, 1990. PROSPECT: a model of leaf optical properties spectra[J]. Remote Sensing of Environment, 34(2): 75-91. doi: 10.1016/0034-4257(90)90100-Z [25] Jacquemoud S, Verhoef W, Baret F, et al, 2009. PROSPECT+SAIL models: A review of use for vegetation characterization[J]. Remote Sensing of Environment, 113(S1): S56-S66. doi: 10.1016/j.rse.2008.01.026 [26] Kuye A, Jagtap S S, 1992. Analysis of solar radiation data for Port Harcourt, Nigeria[J]. Solar Energy, 49(2): 139-145. doi: 10.1016/0038-092X(92)90148-4 [27] Kwon H, Kim J, Hong J, et al, 2010. Influence of the Asian monsoon on net ecosystem carbon exchange in two major ecosystems in Korea[J]. Biogeosciences, 7(5): 1493-1504. doi: 10.5194/bg-7-1493-2010 [28] Li R, Lombardozzi D, Shi M, et al, 2022. Representation of leaf-to-canopy radiative transfer processes improves simulation of far-red solar-induced chlorophyll fluorescence in the Community Land Model Version 5[J]. Journal of Advances in Modeling Earth Systems, 14(3): e2021MS002747. doi: 10.1029/2021MS002747 [29] Liu B Y H, Jordan R C, 1960. The interrelationship and characteristic distribution of direct, diffuse and total solar radiation[J]. Solar Energy, 4(3): 1-19. doi: 10.1016/0038-092X(60)90062-1 [30] Liu L, Cheng Z, 2010. Detection of vegetation light-use efficiency based on solar-induced chlorophyll fluorescence separated from canopy radiance spectrum[J]. IEEE Journal of Selected Topics in Applied Earth Observations and Remote Sensing, 3(3): 306-312. doi: 10.1109/JSTARS.2010.2048200 [31] Ma J, Xiao X, Zhang Y, et al, 2018. Spatial-temporal consistency between gross primary productivity and solar-induced chlorophyll fluorescence of vegetation in China during 2007-2014[J]. Science of The Total Environment, 639(15): 1241-1253. doi: 10.1016/j.scitotenv.2018.05.245 [32] Madani N, Kimball J S, Affleck D L R, et al, 2014. Improving ecosystem productivity modeling through spatially explicit estimation of optimal light use efficiency[J]. Journal of Geophysical Research: Biogeosciences, 119(9): 1755-1769. doi: 10.1002/2014JG002709 [33] Meroni M, Busetto L, Colombo R, et al, 2010. Performance of spectral fitting methods for vegetation fluorescence quantification[J]. Remote Sensing of Environment, 114(2): 363-374. doi: 10.1016/j.rse.2009.09.010 [34] Pedrós R, Goulas Y, Jacquemoud S, et al, 2010. FluorMODleaf: A new leaf fluorescence emission model based on the PROSPECT model[J]. Remote Sensing of Environment, 114(1): 155-167. doi: 10.1016/j.rse.2009.08.019 [35] Piao S, He Y, Wang X, et al, 2022. Estimation of China’s terrestrial ecosystem carbon sink: Methods, progress and prospects[J]. Science China Earth Sciences, 65(4): 641-651. doi: 10.1007/s11430-021-9892-6 [36] Porcar-Castell A, Tyystjärvi E, Atherton J, et al, 2014. Linking chlorophyll a fluorescence to photosynthesis for remote sensing applications: mechanisms and challenges[J]. Journal of Experimental Botany, 65(15): 4065-4095. doi: 10.1093/jxb/eru191 [37] Prikaziuk E, Migliavacca M, Su Z (Bob), et al, 2023. Simulation of ecosystem fluxes with the SCOPE model: Sensitivity to parametrization and evaluation with flux tower observations[J]. Remote Sensing of Environment, 2023,284: 113324. doi: 10.1016/j.rse.2022.113324 [38] Prikaziuk E, Ntakos G, ten Den T, et al, 2022. Using the SCOPE model for potato growth, productivity and yield monitoring under different levels of nitrogen fertilization[J]. International Journal of Applied Earth Observation and Geoinformation, 114: 102997. doi: 10.1016/j.jag.2022.102997 [39] Qiu B, Chen J M, Ju W, et al, 2019. Simulating emission and scattering of solar-induced chlorophyll fluorescence at far-red band in global vegetation with different canopy structures[J]. Remote Sensing of Environment, 233: 111373. doi: 10.1016/j.rse.2019.111373 [40] Qiu R, Han G, Ma X, et al, 2020. CO2 Concentration, A Critical Factor Influencing the Relationship between Solar-induced Chlorophyll Fluorescence and Gross Primary Productivity[J]. Remote Sensing, 12(9): 1377. doi: 10.3390/rs12091377 [41] Raj R, Hamm N A S, Tol C V D, et al, 2016. Uncertainty analysis of gross primary production partitioned from net ecosystem exchange measurements[J]. Biogeosciences, 13(5): 1409-1422. doi: 10.5194/bg-13-1409-2016 [42] Sinha S K, Padalia H, Patel N R, et al, 2020. Estimation of seasonal sun-induced fluorescence dynamics of Indian tropical deciduous forests using SCOPE and Sentinel-2 MSI[J]. International Journal of Applied Earth Observation and Geoinformation, 91: 102155. doi: 10.1016/j.jag.2020.102155 [43] Sun Y, Frankenberg C, Wood J D, et al, 2017. OCO-2 advances photosynthesis observation from space via solar-induced chlorophyll fluorescence[J]. Science, 358(6360): eaam5747. doi: 10.1126/science.aam5747 [44] Thurner M, Beer C, Santoro M, et al, 2014. Carbon stock and density of northern boreal and temperate forests[J]. Global Ecology and Biogeography, 23(3): 297-310. doi: 10.1111/geb.12125 [45] van der Tol C, Verhoef W, Rosema A, 2009a. A model for chlorophyll fluorescence and photosynthesis at leaf scale[J]. Agricultural and Forest Meteorology, 149(1): 96-105. doi: 10.1016/j.agrformet.2008.07.007 [46] van der Tol C, Verhoef W, Timmermans J, et al, 2009b. An integrated model of soil-canopy spectral radiances, photosynthesis, fluorescence, temperature and energy balance[J]. Biogeosciences, 6(12): 3109-3129. doi: 10.5194/bg-6-3109-2009 [47] Verhoef W, 1984. Light scattering by leaf layers with application to canopy reflectance modeling: The SAIL model[J]. Remote Sensing of Environment, 16(2): 125-141. doi: 10.1016/0034-4257(84)90057-9 [48] Verrelst J, Rivera J P, van der Tol C, et al, 2015. Global sensitivity analysis of the SCOPE model: What drives simulated canopy-leaving sun-induced fluorescence?[J]. Remote Sensing of Environment, 166: 8-21. doi: 10.1016/j.rse.2015.06.002 [49] Verrelst J, van der Tol C, Magnani F, et al, 2016. Evaluating the predictive power of sun-induced chlorophyll fluorescence to estimate net photosynthesis of vegetation canopies: A SCOPE modeling study[J]. Remote Sensing of Environment, 176: 139-151. doi: 10.1016/j.rse.2016.01.018 [50] Vilfan N, van der Tol C, Muller O, et al, 2016. Fluspect-B: a model for leaf fluorescence, reflectance and transmittance spectra[J]. Remote Sensing of Environment, 2016,186: 596-615. doi: 10.1016/j.rse.2016.09.017 [51] Wang R, Chen J M, Luo X, et al, 2019a. Seasonality of leaf area index and photosynthetic capacity for better estimation of carbon and water fluxes in evergreen conifer forests[J]. Agricultural and Forest Meteorology, 279(15): 107708. doi: 10.1016/j.agrformet.2019.107708 [52] Wang H, Li X, Ma M, et al, 2019b. Improving estimation of gross primary production in dryland ecosystems by a model-data fusion approach[J]. Remote Sensing, 11(3): 225. doi: 10.3390/rs11030225 [53] Wang H, Xiao J, 2021a. Improving the capability of the SCOPE model for simulating solar-induced fluorescence and gross primary production using data from OCO-2 and flux towers[J]. Remote Sensing, 13(4): 794. doi: 10.3390/rs13040794 [54] Wang Y, Zeng Y, Yu L, et al, 2021b. Integrated modeling of canopy photosynthesis, fluorescence, and the transfer of energy, mass, and momentum in the soil–plant–atmosphere continuum (STEMMUS–SCOPE v1.0. 0)[J]. Geoscientific Model Development, 14(3): 1379-1407. doi: 10.5194/gmd-14-1379-2021 [55] Yang P, Prikaziuk E, Verhoef W, et al, 2021. SCOPE 2.0: a model to simulate vegetated land surface fluxes and satellite signals[J]. Geoscientific Model Development, 14(7): 4697-4712. doi: 10.5194/gmd-14-4697-2021 [56] Yang P, van der Tol C, Verhoef W, et al, 2019. Using reflectance to explain vegetation biochemical and structural effects on sun-induced chlorophyll fluorescence[J]. Remote Sensing of Environment, 231: 110996. doi: 10.1016/j.rse.2018.11.039 [57] Yang P, Verhoef W, van der Tol C, et al, 2017. The mSCOPE model: A simple adaptation to the SCOPE model to describe reflectance, fluorescence and photosynthesis of vertically heterogeneous canopies[J]. Remote Sensing of Environment, 201: 1-11. doi: 10.1016/j.rse.2017.08.029 [58] Yang X, Tang J, Mustard J F, et al, 2015. Solar-induced chlorophyll fluorescence that correlates with canopy photosynthesis on diurnal and seasonal scales in a temperate deciduous forest[J]. Geophysical Research Letters, 42(8): 2977-2987. doi: 10.1002/2015GL063201 [59] Yuan W, Zheng Y, Piao S, et al, 2019. Increased atmospheric vapor pressure deficit reduces global vegetation growth[J]. Science Advances, 5(8): eaax1396. doi: 10.1126/sciadv.aax1396 [60] Zarco-Tejada P J, Miller J R, Pedrós R, et al, 2006. FluorMODgui V3.0: A graphic user interface for the spectral simulation of leaf and canopy chlorophyll fluorescence[J]. Computers & Geosciences, 32(5): 577-591. doi: 10.1016/j.cageo.2005.08.010 [61] Zarco-Tejada P J, Suárez L, González-Dugo V, 2013. Spatial resolution effects on chlorophyll fluorescence retrieval in a heterogeneous canopy using hyperspectral imagery and radiative transfer simulation[J]. IEEE Geoscience and Remote Sensing Letters, 10(4): 937-941. doi: 10.1109/LGRS.2013.2252877 [62] Zhang Y, Guanter L, Berry J A, et al, 2016a. Model-based analysis of the relationship between sun-induced chlorophyll fluorescence and gross primary production for remote sensing applications[J]. Remote Sensing of Environment, 187: 145-155. doi: 10.1016/j.rse.2016.10.016 [63] Zhang Y, Guanter L, Berry J A, et al, 2014. Estimation of vegetation photosynthetic capacity from space-based measurements of chlorophyll fluorescence for terrestrial biosphere models[J]. Global Change Biology, 20(12): 3727-3742. doi: 10.1111/gcb.12664 [64] Zhang Y, Guanter L, Joiner J, et al, 2018. Spatially-explicit monitoring of crop photosynthetic capacity through the use of space-based chlorophyll fluorescence data[J]. Remote Sensing of Environment, 210: 362-374. doi: 10.1016/j.rse.2018.03.031 [65] Zhang Y, Xiao X, Jin C, et al, 2016b. Consistency between sun-induced chlorophyll fluorescence and gross primary production of vegetation in North America[J]. Remote Sensing of Environment, 183: 154-169. doi: 10.1016/j.rse.2016.05.015 [66] Zhao F, Dai X, Verhoef W, et al, 2016. FluorWPS: a Monte Carlo ray-tracing model to compute sun-induced chlorophyll fluorescence of three-dimensional canopy[J]. Remote Sensing of Environment, 187: 385-399. doi: 10.1016/j.rse.2016.10.036 [67] Zhu J, Fan Z, Zeng D, et al, 2003. Comparison of stand structure and growth between artificial and natural forests of Pinus sylvestiris var. mongolica on sandy land[J]. Journal of Forestry Research, 14(2): 103-111. doi: 10.1007/BF02856774 -


 点击查看大图
计量
- 文章访问数: 90
- HTML全文浏览量: 25
- PDF下载量: 8
- 被引次数: 0